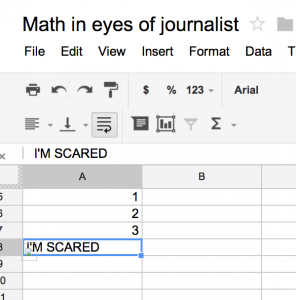
There’s nothing less funny than listening to a journalism professor joking that we’re all in this field because we can’t do math. Some of the best journalism being done today only exists because journalists overcame their fear of numbers and dug deep into the data.
Take the L.A. Times’s series on 911 response times. An analysis found stark disparities in the response times of emergency vehicles, and it produced journalism with real impact. Not bad for a bit of math.
Or look at USA Today’s diversity index. Journalist Phil Meyer and Paul Overberg, the paper’s database editor, invented a way to numerically compare racial and ethnic diversity — no small feat back in 2001. This index opened up a wealth of unreported stories, and gave measurable evidence to those we only believed anecdotally.
You might say, “But these are both CAR stories,” and you’d be right. But we are all computer-assisted reporters. The moment a news organization sheds the backwards thought that only a select few can understand data, millions of uncovered stories will be discovered.
In a recent talk, Ryan Pitts, senior editor for digital media at The Spokesman-Review, and Jeremy Bowers, news applications developer at NPR, walked through how indexes like USA Today’s can be created to fit your beat. How does this business tax proposal compare to previous laws? Create an index for it. Which college is the most cost-effective for students? Ditto. If Nate Silver of the New York Times has taught us anything, it’s that people trust data over a reporter’s intuition.
Of course, not all questions can be answered with indexes. Statistics provides the tools to figure out information we haven’t even considered yet. The more mathematically savvy journalists you have in your newsroom, the more groundbreaking journalism your company will produce. (And yes, that could be quantified.)
Recently Chase Davis, new assistant editor of interactive news at the New York Times, explained five algorithms with huge potential that journalists have not yet explored. Want to know which politicians in your state are the most similar? Run a nearest neighbor analysis. Need to classify thousands of bills into clean categories? Try a random forest algorithm, and let the robots do the work for you.
The more we become familiar with these sorts of solutions, the more stories we can pitch. Editors love reporters who find new angles on our world, and data-driven work is no exception.
And here’s the best part: The hard work has already been done for us. Open source tools exist to ease the computation efforts of these statistical models. We’re on the brink of using technology to better understand subjects as complex as campaign finance and how elections are won. Mathematicians have produced loads of information analysis techniques that are just waiting to be taken advantage of by journalists. We don’t need to be experts in statistics to find answers to our interesting questions.* We just have to get over our fear of numbers.
If you can say “algorithm” with a straight face, I’ll bet there’s a job out there for you. And don’t let your journalism professors get away with their cheap math jokes. The times have changed.
*Of course, it’s easy to lie with data. Be sure to run your work by someone who does know what they’re talking about before publishing.
 This is one of a series of blog posts from the first ONA class of AP-Google Journalism and Technology Scholars describing their experiences, projects and sharing their knowledge with the ONA community.
Kevin Schaul is Data/Web Dev Intern at @StarTribune and is joining @nytgraphics for the summer.

