Immersive Case Study: Sacramento Bee 3D Explainer
Published July 10, 2020
This case study is part of the broader Guide to Immersive Ethics. Learn more in the overview, including what ethical criteria to consider when starting a new immersive project.
The team working at McClatchy New Ventures Lab collaborated with The Sacramento Bee to produce a 3D animated explainer about the shooting death of Sacramento Police Department Officer Tara O’Sullivan. This piece features 3D assets modeled by David Martinez, police scanner audio from the scene and 3D callout boxes with contextual information with fact-checking by Melanie Hogue. Jayson Chesler brought it all together as the producer.
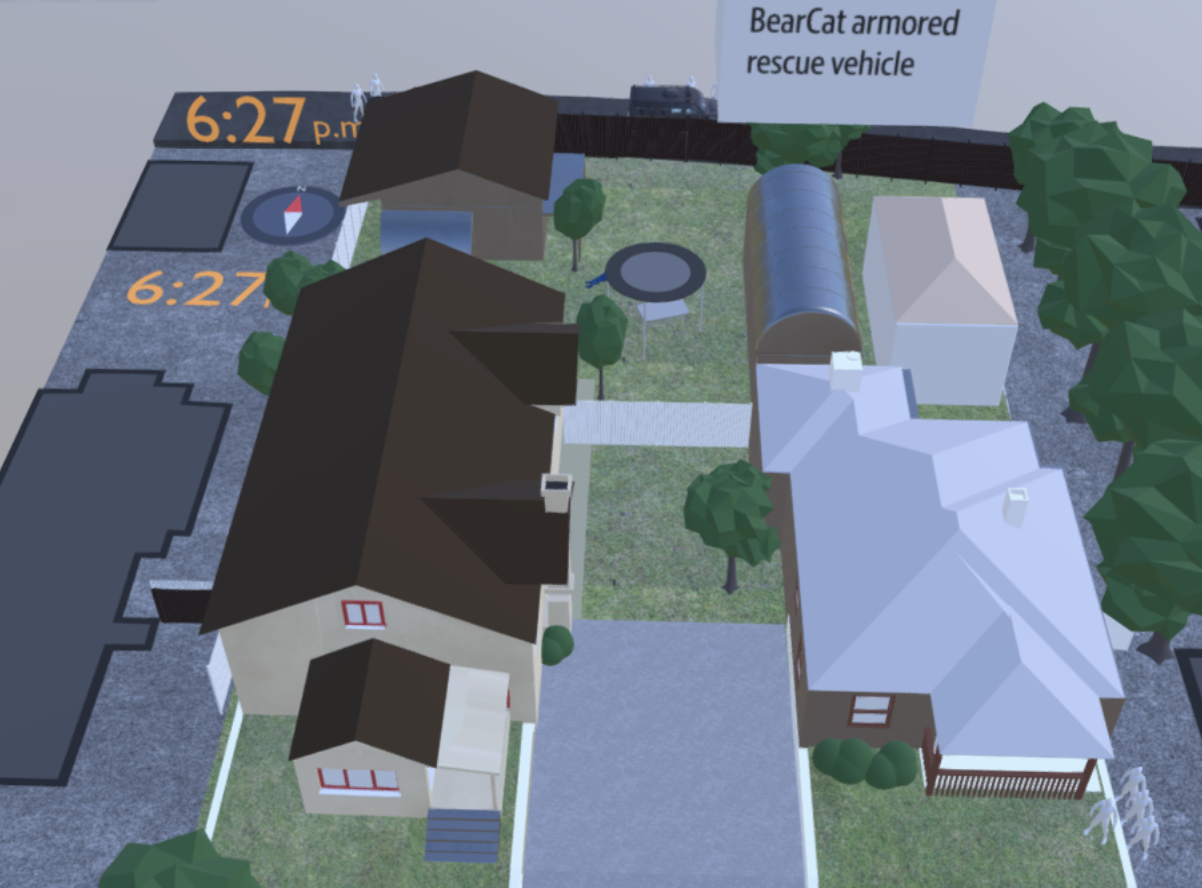
A 3D animation approach was taken to answer one fundamental question about the scene: why did it take officers 47 minutes to rescue Officer O’Sullivan? Since the public had confusion about what exactly had happened and limited access through reporters to the environment itself, a 3D representation seemed like an appropriate way to show the events accurately.
Sourcing visuals
 Since the area represented in the piece was a crime scene in a residential area, we were unable to physically visit the site. Instead, the visuals were created using a mix of drone footage, Google Maps imagery and bodycam footage for references.
The Sac Bee’s Daniel Kim filmed drone footage the week after the shooting and made it available for the NVL team to work with. This footage was cross-referenced with imagery from Google Maps, which was more complete but was somewhat out-dated. Any areas that had changed since Google Maps’ last update were paid extra attention, since they were less easily fact checked with a quick look at the map. Finally, some specific areas of particular importance appeared on bodycam footage released by the police department. This footage was used to finetune a few particular details, including a taller-than-expected, overturned trampoline and the distance between some of the structures in the backyard.
Only showing known truth
 There were a lot of unknowns within this story that had to be accounted for in the final product. Police officials gave a detailed rundown of every time the suspect fired his gun during the standoff, but did not clarify where he was located while shooting. Similarly, the scanner audio mentioned multiple times that officers were concerned that the suspect had access to multiple houses, sheds and other structures and weren’t certain where he was. As such, the visualization doesn’t attempt to show where shots are being fired from, and instead a “shots fired” graphic flashes across the entire scene.
A similar combination of official statements and scanner audio gave a general picture of where officers were positioned during the event. However, the path the police took from position to position was not demonstrated, and was particularly difficult to figure out given the confusing layout of the backyard and surrounding area. The only bodycam footage released showed the moments after the initial shots were fired, when officers retreated from their initial positions. Since there were too many variables and not enough information to know for certain how the police officers and vehicles got from each position that they described in the scanner audio, the piece does not tween from one position to the next. Instead, the recreation serves as more of a 3D audio slideshow than a video with interpolation between frames, which also saved time during production.
Lastly, the visual style of the piece was meant to show a certain level of overall uncertainty. While a photogrammetry capture of the crime scene was never a viable option, a 3D artist could make a more realistic depiction of the environment. Rather than focusing attention on trying to get every inch of real estate correct and photorealistic, a more blueprint-esque style was chosen so the team could work quickly — before the news cycle had passed — and so the team could focus their efforts on fact-checking events and not just visual details.
Representing time and space
The events shown take place over 47 minutes, but the visualization only lasts for five. Like in traditional video or audio reporting, the team cut large portions of scanner audio to better and more efficiently tell the story. To show the passage of time, the team placed a clock graphic in the top left corner of the visualization. The events that play out, the audio on the scanner and the shots fired graphics are all synchronized with the times shown.